KPI Treatment
The KPI treatment provides objective evidence of progress towards achieving the desired result. It measures what is intended to be measured to help inform better decision-making. Offer a comparison that gauges the degree of performance change over time.
1. On the Settings Dashboard page, click the “Reports” button.

2. Click the “KPIs” button and the list of available KPIs will be displayed. Click the “Treatments” button to show the reports.

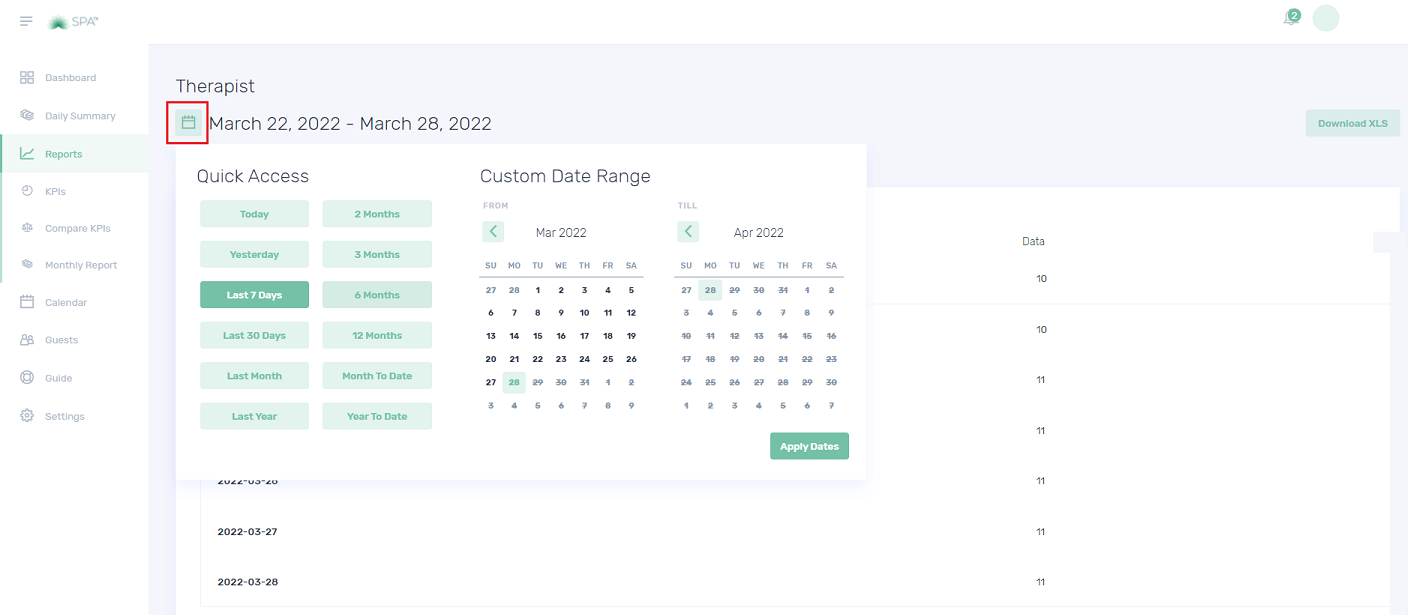
3. Click the calendar button to choose the preferred date you wish to view, and then click the “Apply Dates” button.

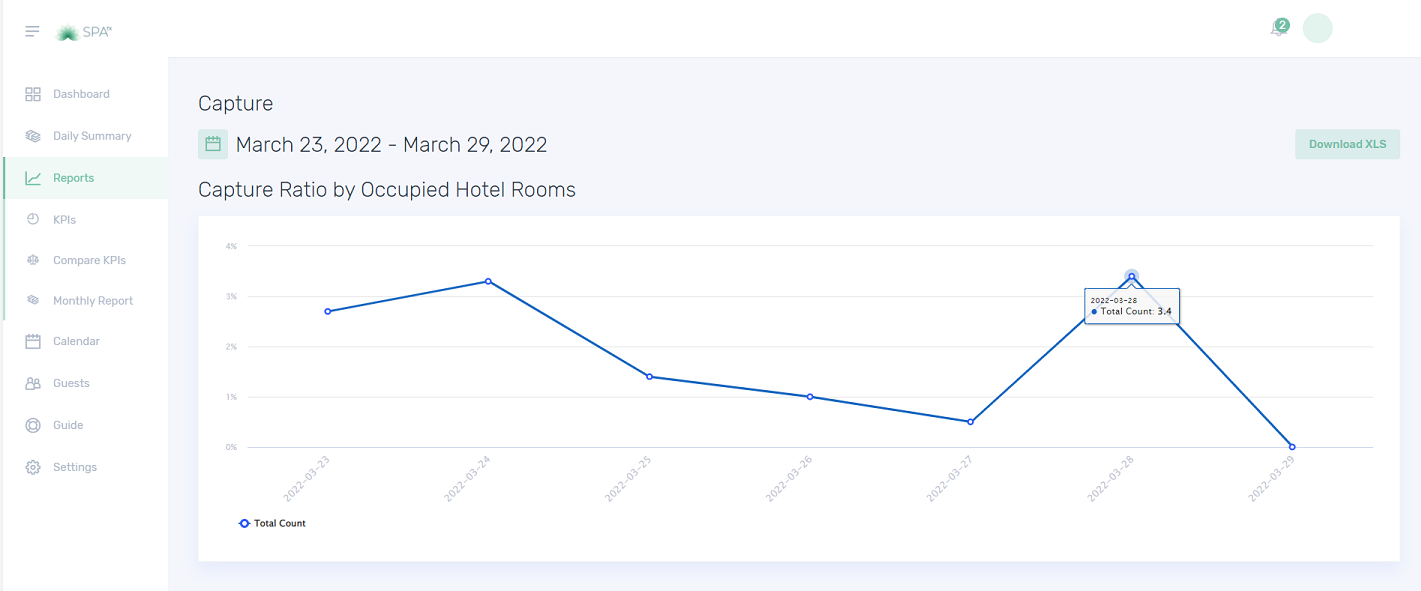
4. The Booked Treatments in Category displays the total number of booked treatments per category. Category can be filtered by clicking the “Filter” function. You can hover over the graph line to see the revenue amount.

5. The next table graph is the Booked Treatment Quantity. This counts the total number of booked treatments. You can select the treatment by using the “Filter” button.

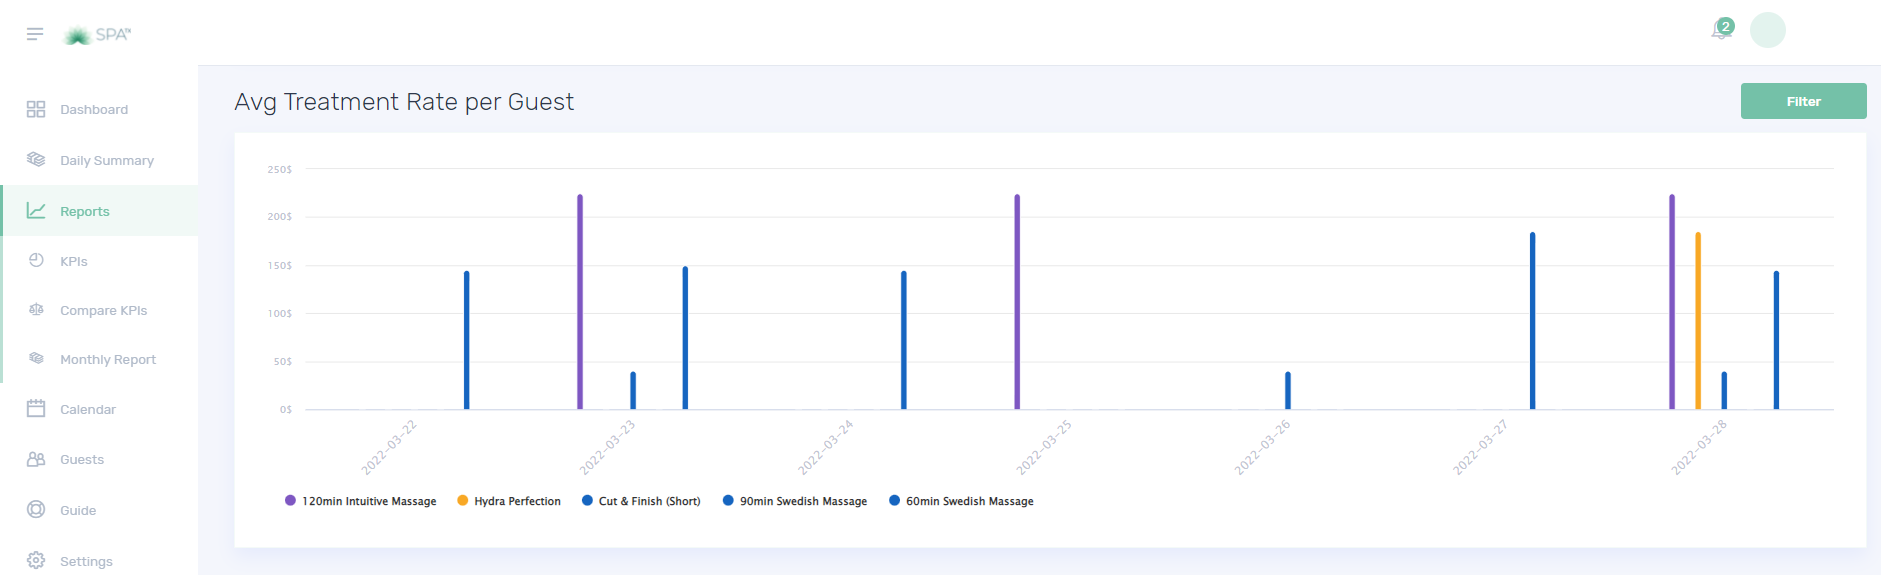
6. The Avg Treatment Rate per Paid Treatment in Category.

7. The Average Treatment Rate per Paid Treatment calculates the ratio of paid treatments.

8. Other reports that can be filtered by category or by specific treatment.


Quiz – Choose the correct answer.
1. What information do the Booked Treatments in Category provide?
a. Treatment category
b. Number of complimentary treatments per category
c. Number of treatments per category
2. What information does the Booked Treatment Quantity provide?
a. The Total number of booked treatments
b. The total number of booked treatments per category
c. None of the above
3. Choose the table graph that can be found in KPI Treatment
a. Average treatment rate per paid treatment
b. Average treatment rate per room in the category
c. Both a and b
If you need further assistance, please send an email to helpdesk@spa-tx.com


 Quiz – Choose the correct answer.