The KPI Therapist gives you an insight into the average amount of revenue being generated per available Therapist. Revenue per therapist helps you determine if your therapists are effectively managing their time.
1. On the Settings Dashboard page, click the “Reports” button.

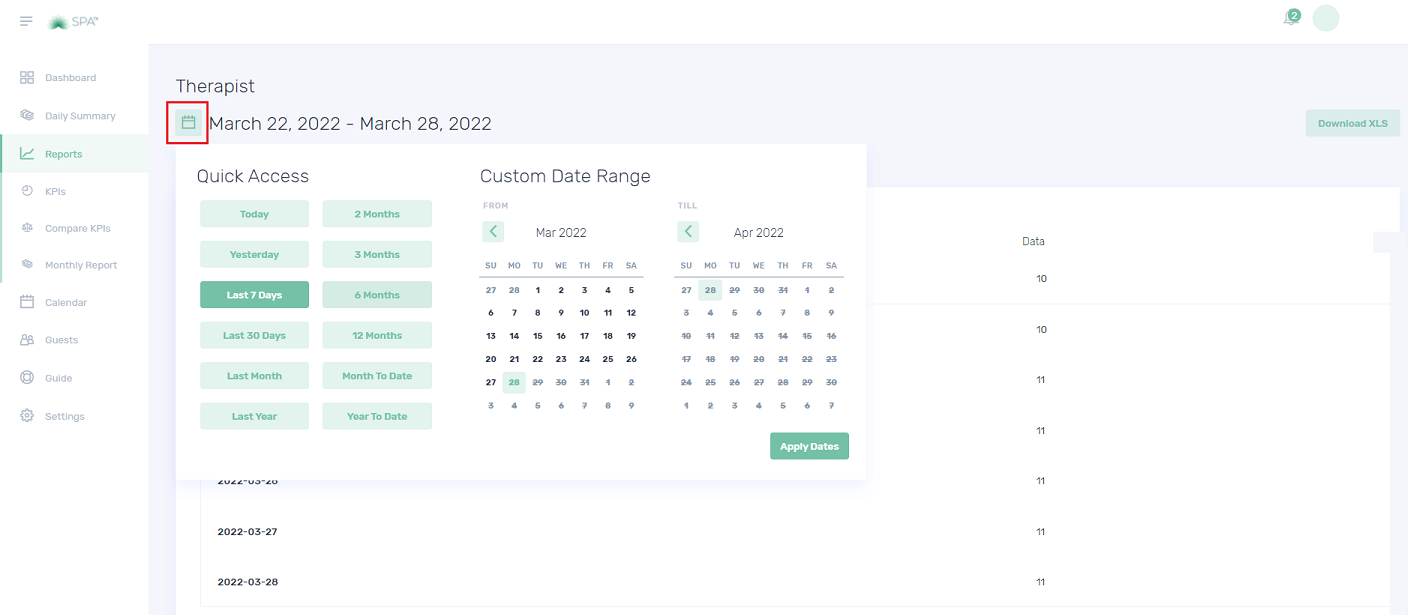
2. Click the “KPIs” button and the list of available KPIs will be displayed. Click the “Rooms” button to show the reports.


Quiz – Choose the correct answer.
1. Which table graph shows the number of paid and complimentary treatments done by a
therapist?
a. Generated revenue per therapist.
b. Therapist utilization.
c. Booked treatment quantity
2. What do you mean by Therapist Utilization?
a. The therapist’s actual time usage
b. The therapist’s total number of treatments
c. Both a and b
3. Which KPI provides Therapist Quantity?
a. KPI Therapist
b. KPI Therapist Availability
c. KPI Treatment
If you need further assistance, please send an email to helpdesk@spa-tx.com